Reporting foundations for a CPG brand
Reporting that survives 300% growth.
I build production, supply chain and sales reporting for founder-led CPG brands: the warehouse, the syncs, the dashboards, then the alerts and the AI on top. All of it runs on infrastructure you own.
What I heard
A brand at your stage usually looks like this
Growing fast, adding retailers and SKUs at the same time, and running the whole operation on tools that were fine at a tenth of the volume.
- Operations
- Spreadsheets. Production, WIP and finished goods tracked by hand across several co-packers.
- Finance
- QuickBooks for the books. Board pack pulled together by one person, top-line only.
- Partners
- Co-packer data arriving as PDFs, emails and irregular exports. One site worse than the others.
- Retail data
- SPINS and retailer portals paid for, barely opened. Shipments known, depletion mostly not.
- Ask
- Foundational reporting first. AI on top later, for analysis and Slack alerts, not as the product.
None of this needs to change on your partners' side. They keep sending what they send today. The system I build parses it, validates it, logs what failed, and puts the rest where leadership can see it.
Three things to look at
The CPG reporting demo
A fictional frozen-food brand with synthetic data. Overview, sales and depletion, production and supply, data sources, and an AI layer that sits on top. Click around.
Open the demo → Selected workWhat this looks like when it is real
A reporting layer for a bottled water brand, an inventory integration that fixed the revenue number, supply planning, and email-to-pipeline automation.
See the work → How I would startDiscovery, build, retainer
Two weeks to map every source and define the ten numbers leadership needs. Six to ten weeks to build, first visible win inside week three. Then I stay on as your technical lead.
Read the approach →A reporting app built for a bottled water brand, rebuilt here with synthetic data
Sales, inventory and finance screens modelled on a live deployment, simplified, with made-up numbers. It shows the shape of the thing, not the client's data.
Where the numbers go
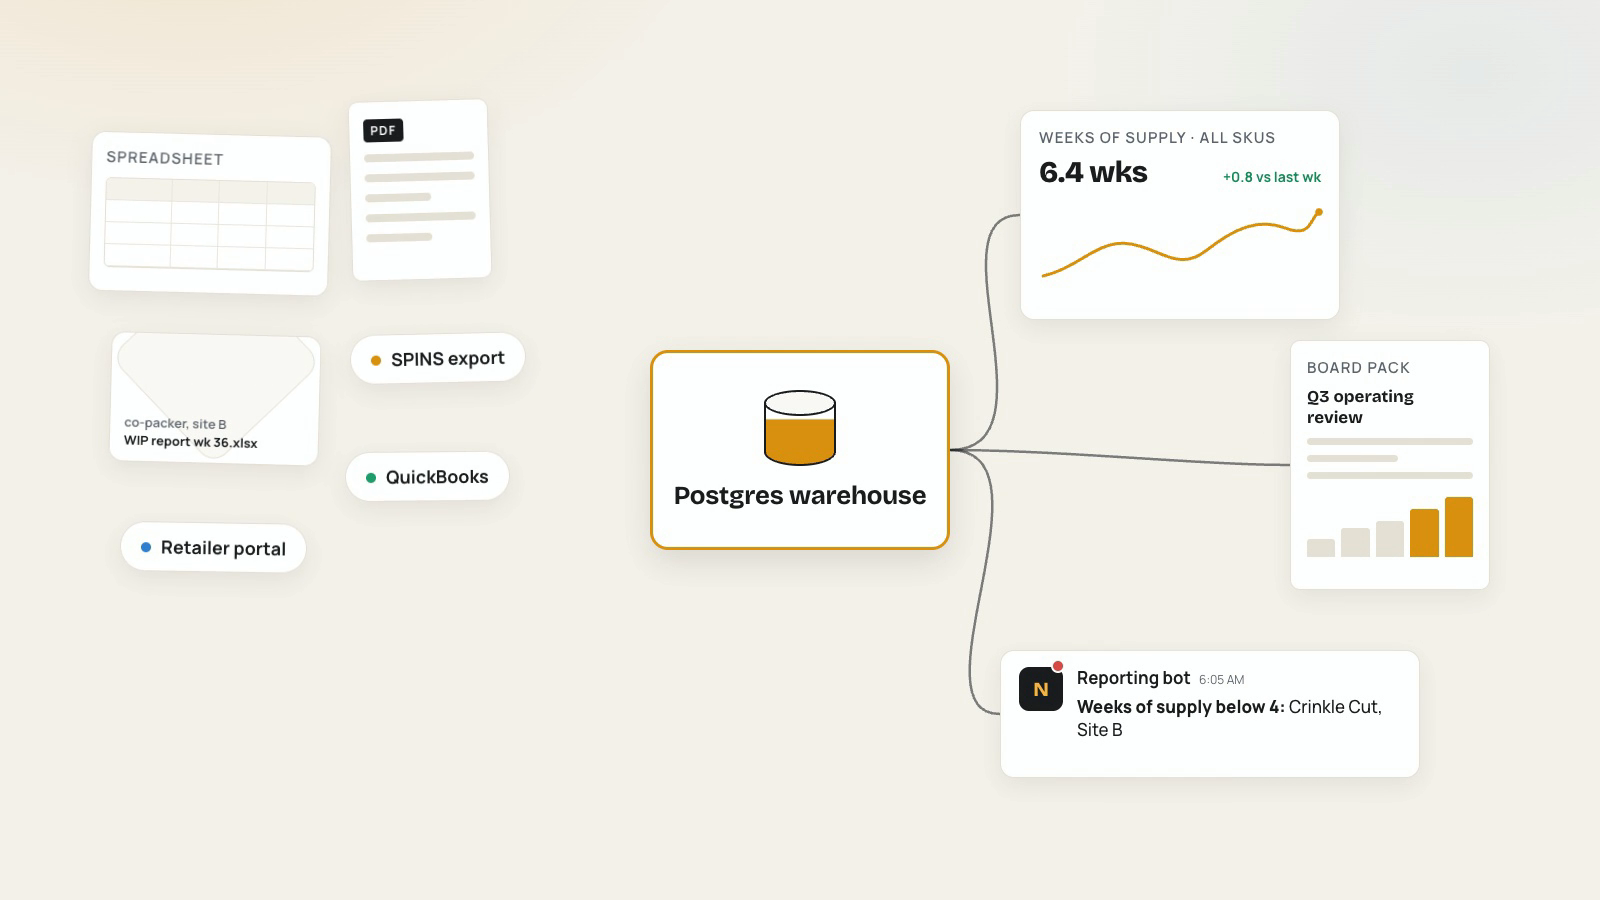
From partner files to a board pack, one path
Every number on every dashboard traces back to a file, a row and a load time. That is what makes it survive a board question.
- 1 Partner filesCSV, PDF, email, portal exports
- 2 Parsed and validatedEvery row checked, every failure logged
- 3 Postgres warehouseOn infrastructure you own
- 4 Self-serve dashboardsMetabase, company Google login
- 5 Slack and AI on topAlerts, board pack, questions in plain English
Referred by David Kimmell.